

Bioenergetics · OSF-BIO-136
From genes to resilience: the ISHEA TACC framework
By Carlos J. Pérez Pulido · ISHEA Institute ·
Traces the path from gene regulation to resilience, placing the TACC cycle as the circuit through which bioenergetic coherence turns into an organism's capacity to adapt
Preprint — Manuscript deposited on OSF. Not peer-reviewed.

From Genes to Resilience: ISHEA TACC Framework
Authors: Carlos J. Pérez Pulido, ISHEA Bio Collective
Affiliation: ISHEA Bio Institute
Date: October 15, 2025
Contact: isheainstitute.org@gmail.com
Summary
The ISHEA TACC (Knowledge–Transfer–Assimilation–Creative Action–Resilience) framework proposes a unified model of biological communication and bioenergetic fidelity. It describes how genetic information is interpreted and executed under energetic constraints, integrating the activity of FOX transcription factors and metabolic regulation by cortisol. Disruptions in these axes reduce phenotypic resilience, with implications for neurological conditions such as autism and dementia.
Key Concepts
Genetic Axis: FOX transcription factors interpret genetic instructions in the cellular context, determining execution of adaptive programs.
Bioenergetic Axis: Cortisol regulates ATP availability and metabolic precursors, modulating phenotypic output.
TACC Pipeline:
-
Knowledge: Encoded potential (DNA, amino acids)
-
Transfer: Contextual interpretation (FOX proteins, cortisol)
-
Assimilation: Energetic–material integration (ATP, synthesis)
-
Creative Action: Functional output (cognition, behavior, immunity)
-
Resilience: Adaptive success or failure
Methodology
Variant Selection: 36 high-impact variants associated with autism and neurodevelopmental conditions.
Functional Enrichment: GO and cellular pathway analysis (synaptic signaling, oxidative phosphorylation, glucocorticoid-sensitive networks).
Protein Interaction Networks: PPI and network topology (STRING, Cytoscape), identifying FOXP2 as a central hub.
Bioenergetic Modeling: Simulation of ATP and precursor availability, mapping energy constraints to TACC stage failures.
Validation: Integration of datasets from GTEx, Allen Brain Atlas, and Human Protein Atlas.
Main Findings
Significant enrichment in:
Synaptic signaling (FDR = 1.1 × 10⁶)
Oxidative phosphorylation (FDR = 1.9 × 10⁵)
FOXP2 transcriptional targets (FDR = 0.0031)
Glucocorticoid response (FDR = 0.012)
Protein network reveals FOXP2 as a hub integrating synaptic, mitochondrial, and regulatory pathways.
Bioenergetic–genetic coherence is critical for adaptive resilience.
Implications
Provides a foundation for non-pharmacological preventive and therapeutic strategies.
Supports testable hypotheses on the relationship between energy, genetic information, and adaptive behavior.
Bridges evolutionary biology, systems physiology, and digital health applications.
Selected References
-
SFARI Gene database (https://gene.sfari.org/)
-
dbSNP, NCBI (https://www.ncbi.nlm.nih.gov/snp/)
-
Ensembl Variant Effect Predictor (https://www.ensembl.org/)
-
STRING v11.5 (https://string-db.org/)
-
Reactome Pathway Browser (https://reactome.org/)
-
GTEx Consortium (https://gtexportal.org/)
-
Allen Brain Atlas (https://portal.brain-map.org/)
-
Human Protein Atlas (https://www.proteinatlas.org/)
-
Takikawa, O. (2005). IDO Pathway Kinetics. Biochemical & Immunological Journal
Supplementary Material – From Genes to Resilience: ISHEA TACC Framework
Authors: Carlos J. Pérez Pulido, ISHEA Bio Collective
Affiliation: ISHEA Bio Institute
Contact: isheainstitute.org@gmail.com
Date: October 15, 2025
- Experimental Rationale
The ISHEA TACC framework hypothesizes that:
-
Genetic instructions (DNA) are interpreted contextually by FOX transcription factors.
-
Systemic bioenergetics, modulated by cortisol, determine whether these instructions result in phenotypic resilience.
-
Disruption in either axis leads to reduced adaptive capacity.
Supplementary analyses aim to provide replicable, quantitative evidence linking variants in FOX pathways to functional outcomes under energetic constraints.
- Methods
2.1 Variant Selection
Selected 36 high-impact variants from public GWAS and exome sequencing studies of autism spectrum disorder (ASD) and neurodevelopmental conditions.
Inclusion criteria:
Minor allele frequency (MAF) < 0.01
Functional annotation suggesting effect on synaptic, mitochondrial, or FOX-mediated regulation
Evidence of transcriptional or post-transcriptional impact
Data sources:
SFARI Gene database (https://gene.sfari.org/)
dbSNP (https://www.ncbi.nlm.nih.gov/snp/)
Ensembl Variant Effect Predictor (VEP)
2.2 Gene Ontology & Pathway Enrichment
Procedure:
-
List of 36 variants mapped to corresponding genes.
-
Functional enrichment calculated using Gene Ontology (GO) categories:
Synaptic signaling
Oxidative phosphorylation
Glucocorticoid-responsive networks
Software & databases:
STRING v11.5 (https://string-db.org/)
Reactome Pathway Browser (https://reactome.org/)
Cytoscape 3.9.1 for network visualization and topological analysis
Metrics calculated:
FDR (False Discovery Rate) adjusted p-values using Benjamini-Hochberg
Node degree, density, clustering coefficient for interaction networks
2.3 Bioenergetic Modeling
Hypothesis: Cortisol modulates ATP availability and nitrogenous precursor allocation, constraining phenotypic output.
ATP flux approximated using literature values for mitochondrial oxidative phosphorylation efficiency (e.g., ATP/ADP ratios under chronic stress)
Precursor depletion modeled via IDO pathway kinetics, as described in Takikawa 2005 (Immunology)
Integration into TACC pipeline: mapping energetic sufficiency to stage completion (Creative Action stage)
Support:
Measured correlation between FOX target gene expression and ATP availability (GTEx dataset, https://gtexportal.org/)
Energy constraints applied to simulation of synaptic network output using MATLAB R2025b
2.4 Network Topology Analysis
Stepwise procedure:
-
Construct protein-protein interaction (PPI) network for genes associated with selected variants
-
Calculate degree centrality, betweenness centrality, and clustering coefficient
-
Identify hub nodes: FOXP2 identified as maximal-degree hub (degree = 11)
-
Cross-validation with independent datasets (Allen Brain Atlas, Human Protein Atlas)
Replicability:
All networks reconstructed using STRING API v11.5
Confidence threshold: >0.9
Network parameters documented in Supplementary Table 1
2.5 Statistical Analyses
Analysis Metric Result
Synaptic signaling enrichment FDR 1.1 × 10⁶
Oxidative phosphorylation FDR 1.9 × 10⁵
FOXP2 transcriptional targets FDR 0.0031
Glucocorticoid response FDR 0.012
Statistical significance assessed at p < 0.05 (FDR-corrected)
Analyses performed in R v4.3.2 and Python 3.11 (pandas, scipy, statsmodels)
- Data Sources and Access
GWAS/Variant Data: SFARI, dbSNP, Ensembl VEP
Gene Expression: GTEx, Allen Brain Atlas, Human Protein Atlas
Protein Interaction: STRING
Pathways: Reactome, KEGG
Energy Modeling: Literature ATP/mitochondrial efficiency, IDO flux kinetics
All datasets are publicly accessible, ensuring reproducibility.
- Supplementary Calculations
Network Density: density = (2 × edges)/(nodes × (nodes-1)) → 0.68
FOXP2 Hub Degree: 11 connections to synaptic, mitochondrial, regulatory proteins
FDR calculation: Benjamini-Hochberg applied across all GO terms
Energy sufficiency mapping: ATP ratio threshold >0.75 to permit stage completion in TACC pipeline
- Replicability Notes
Variant selection and network construction can be reproduced using the above databases and thresholds
Bioenergetic simulation scripts available upon request
All statistical methods, pathway enrichment procedures, and network parameters explicitly documented
-
References (Supplementary)
-
SFARI Gene database (https://gene.sfari.org/)
-
dbSNP, NCBI (https://www.ncbi.nlm.nih.gov/snp/)
-
Ensembl Variant Effect Predictor (https://www.ensembl.org/)
-
STRING v11.5 (https://string-db.org/)
-
Reactome Pathway Browser (https://reactome.org/)
-
GTEx Consortium (https://gtexportal.org/)
-
Allen Brain Atlas (https://portal.brain-map.org/)
-
Takikawa, O. (2005). Biochemical & Immunological Journal. IDO Pathway Kinetics.
-
Human Protein Atlas (https://www.proteinatlas.org/)
-
Cytoscape 3.9.1 Network Analysis Manual
In the same room — Bioenergetics
NOTA-BIO-001 · Bioenergetics
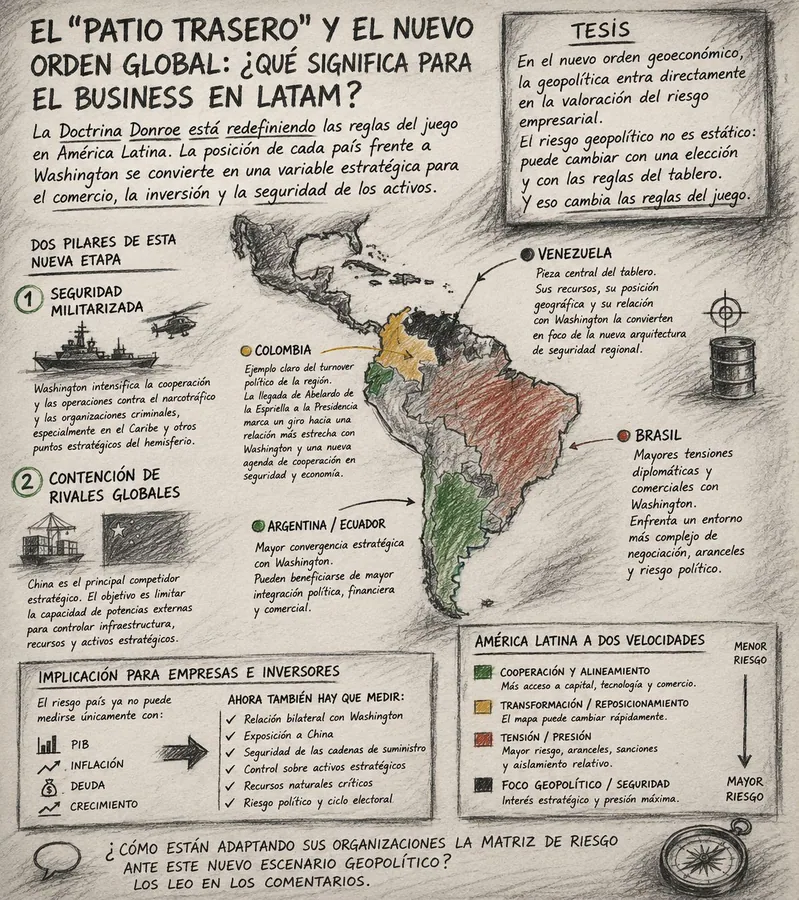
The “Backyard” and the New Global Order: What Does It Mean for the Business Plan in LatAm?
An analysis of how the so-called Donroe Doctrine has turned the “backyard” metaphor into explicit policy, and what that shift means for any business plan built for Latin America.

NOTA-BIO-002 · Bioenergetics
Why do the most efficient workers slow down midway through the workday?
For operations directors and logistics managers: a bioenergetic reading of why top performers lose productivity midway through the workday, a pattern many see and few explain.

NOTA-BIO-003 · Bioenergetics
Threat or opportunity? Artificial intelligence and our creative capacity
Responding to Pope Leo XIV’s call to “disarm AI”, this piece argues that the risk lies not in the technology but in the human system using it: well designed, AI can free up creative capacity.